Creating an app with VS Code
Create the App
Creating an Uno Platform project is done using dotnet new and the Uno Platform Live Wizard by following these steps:
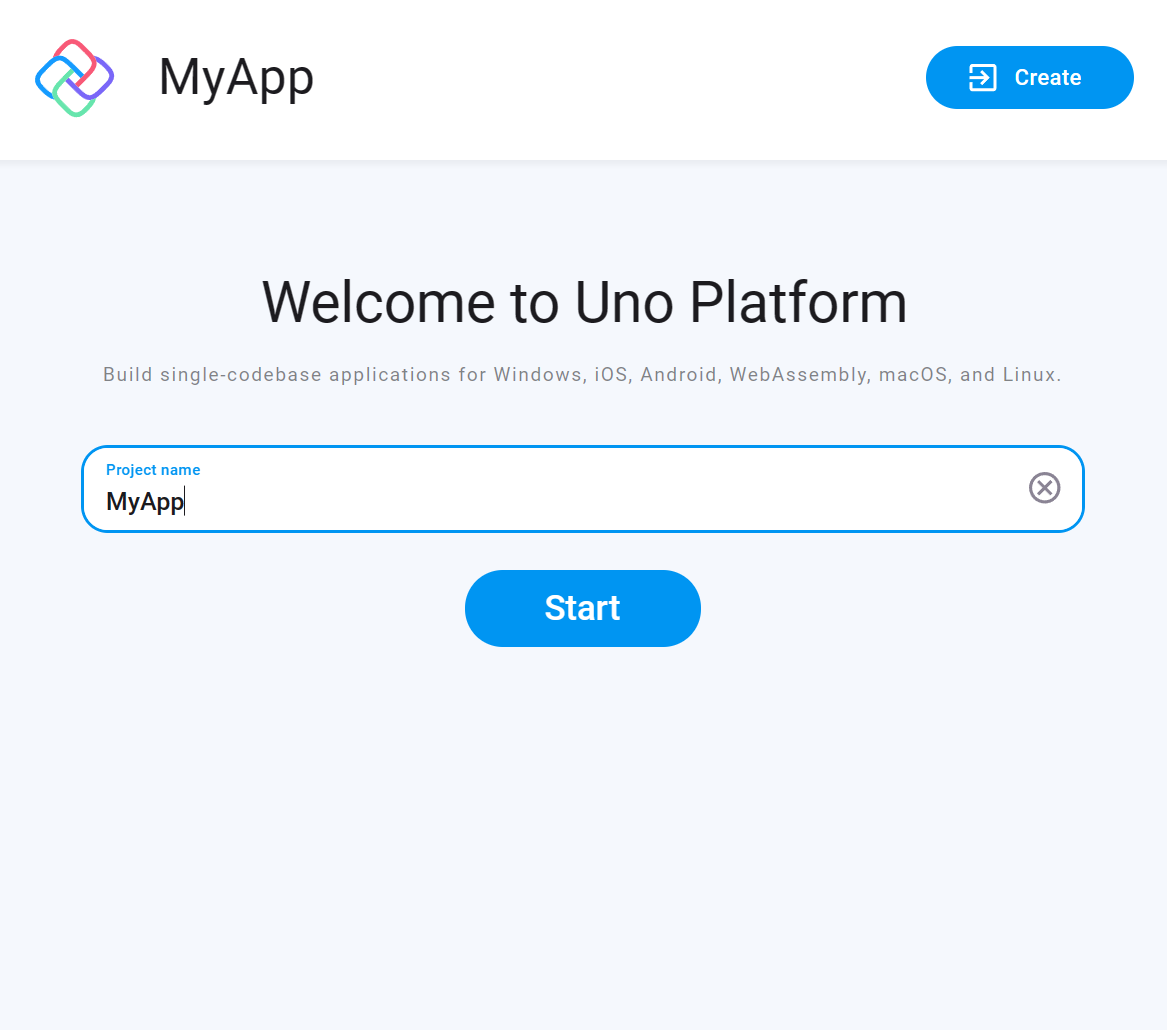
Open a browser and navigate to the online Live Wizard
Configure your new project by providing a project name, then click Start
Choose a template to build your application
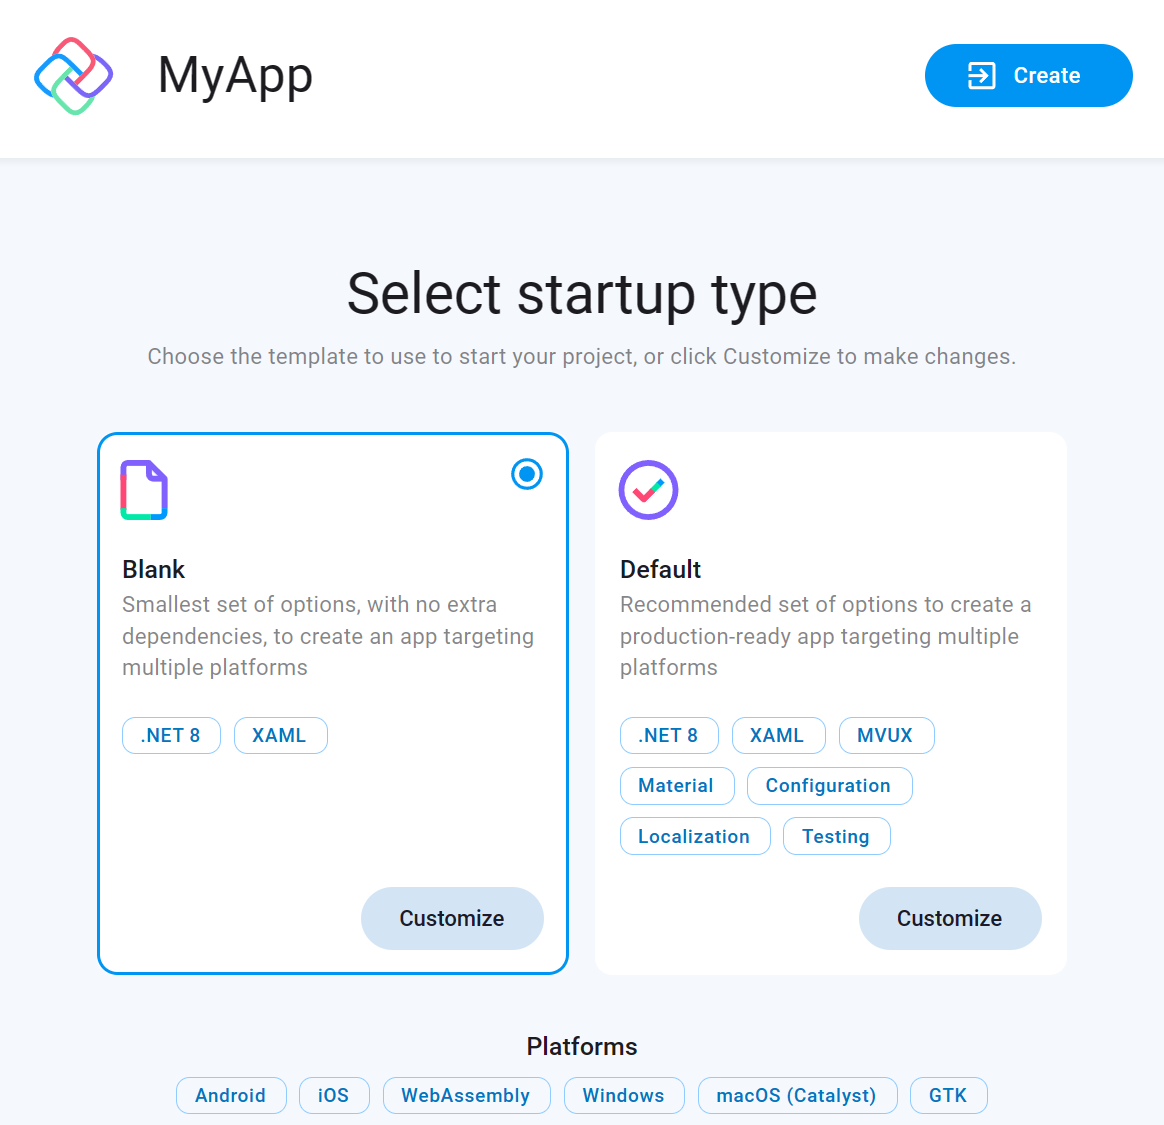
Tip
For a detailed overview of the Uno Platform project wizard and all its options, see the Wizard guide.
Click the Create button on the top right corner, then click the Copy button

In your terminal, navigate to the folder that will contain your new app.
Create a new project by pasting and executing the command that was previously generated in the Live Wizard.
Important
Apple targets cannot be built under Linux. If you are using Linux, you'll need to remove iOS and Catalyst from the platforms list.
Next, open the project using Visual Studio Code:
In the terminal type the following:
code ./MyApp
Visual Studio Code might ask to restore the NuGet packages. Allow it to restore them if asked.
Once the project has been loaded, in the status bar at the bottom left of VS Code, MyApp.sln is selected by default. Select MyApp.Wasm.csproj, MyApp.Skia.Gtk.csproj or MyApp.Mobile.csproj instead.
Debug the App
Uno Platform provides integrated support for debugging your app on Windows, mac and Linux.
- In the debugger section of the activity bar select
Debug (Chrome, WebAssembly)
- In the status bar, ensure the
MyApp.Wasm.csproj project is selected - by default MyApp.sln is selected.
- Press
F5 to start the debugging session
- In the debugger section of the activity bar select
Skia.GTK (Debug)
- In the status bar, ensure the
MyApp.Skia.Gtk.csproj project is selected - by default MyApp.sln is selected.
- Press
F5 to start the debugging session
Note that C# Hot Reload is not available when running with the debugger. In order to use C# Hot Reload, run the app using the following:
On Windows, type the following:
$env:DOTNET_MODIFIABLE_ASSEMBLIES="debug"
dotnet run
On Linux or macOS:
export DOTNET_MODIFIABLE_ASSEMBLIES=debug
dotnet run
In the status bar, select the MyApp.Mobile project - by default MyApp.sln is selected.

To the right of MyApp.Mobile, click on the target framework to select net8.0-android | Debug

Then, to the right of the target framework, select the device to debug with. You will need to connect an android device, or create an Android simulator.

Finally, in the debugger side menu, select the Uno Platform Mobile profile
Either press F5 or press the green arrow to start the debugging session.
Note
Debugging for iOS is only possible when running locally (or remotely through Remote SSH) on a macOS machine.
In the status bar, select the MyApp.Mobile project - by default MyApp.sln is selected.
To the right of MyApp.Mobile, click on the target framework to select net8.0-ios | Debug

Then, to the right of the target framework, select the device to debug with. You will need to connect an iOS device, or use an existing iOS simulator.

Finally, in the debugger side menu, select the Uno Platform Mobile profile
Either press F5 or press the green arrow
Tip
When deploying to an iOS device, you may encounter the following error: errSecInternalComponent. In such case, you'll need to unlock your keychain from a terminal inside VS Code by running the following command: security unlock-keychain
Note
Debugging for Mac Catalyst is only possible when running locally (or remotely through Remote SSH) on a macOS machine.
In the status bar, select the MyApp.Mobile project - by default MyApp.sln is selected.
To the right of MyApp.Mobile, click on the target framework to select net8.0-maccatalyst | Debug

Finally, in the debugger side menu, select the Uno t Mobile profile
Either press F5 or press the green arrow to start the debugging session.
You're all set!
You can also find additional VS Code topics, such as using snippets, updating existing apps to use VS Code
Next Steps
Now that you're Created and Debug the App.
Learn more about: